Blog

How influential you feel depends on where you live: the role of nation and region in attitudes to politics

6 Jun 2018
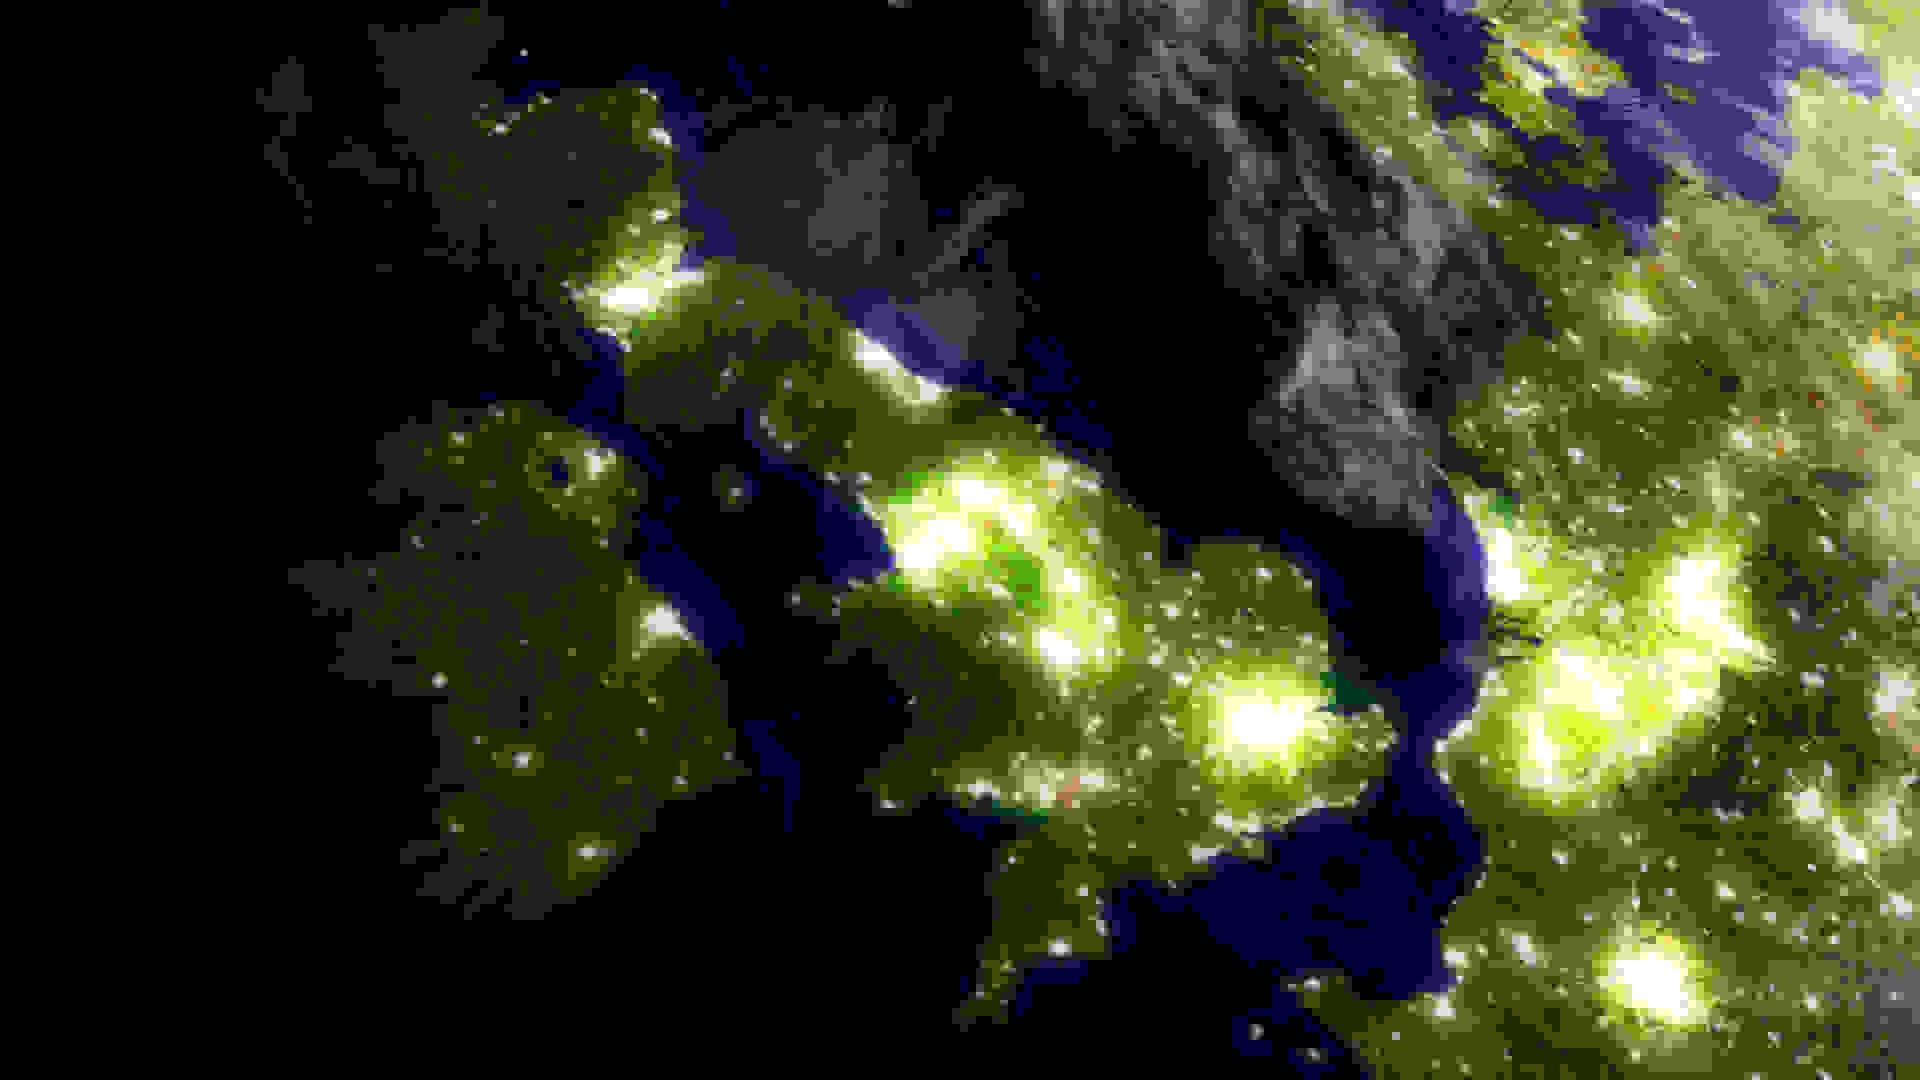
Photo of the United Kindom taken from space at night

New analysis of 15 years of our Audit of Political Engagement data shows how geography is an important factor in determining whether citizens feel they have influence on decision-making at the national level, even when other key factors that influence political engagement - such as education and social class - are taken into account.

Lawrence McKay , ESRC CASE PhD Studentship, University of Manchester/Hansard Society
,
ESRC CASE PhD Studentship, University of Manchester/Hansard Society

Lawrence McKay

Lawrence McKay
ESRC CASE PhD Studentship, University of Manchester/Hansard Society

Lawrence is a PhD student at the University of Manchester. His research focuses on the representation gap, looking at local influences on public perceptions of politics and politicians, and making use in particular of the British Election Study dataset. His work is co-supervised by Professor Edward Fieldhouse and Professor Maria Sobolewska.

Lawrence is an ESRC CASE scholar and his PhD is partly supported by the Hansard Society, with which he collaborates to develop the impact of his research.

Lawrence was previously a student at the University of Exeter, completing a BA in History and an MRes in Politics.

Get our latest research, insights and events delivered to your inbox

Subscribe to our newsletter

We will never share your data with any third-parties.

Share this and support our work

Over the years, the Hansard Society’s annual Audit of Political Engagement has noted the impact of geography on attitudes to politics. Previous Audits have recorded – at one time or another – apparent effects of nation and region on virtually all of the indicators we consider key to understanding public engagement with politics and public attitudes to our political system.

Caution has usually been expressed about many of these findings. The sample sizes obtained for some parts of Britain were often prohibitively small. Differences across the country appeared to fluctuate significantly. Furthermore, we could not be certain that what appeared to be geographical effects were not in fact to do with the sorts of people inhabiting certain areas - for instance, London’s high BME population, or the higher proportion of Conservative voters in the South and East of England.

However, after 15 years of data-gathering it is possible to pool the data - creating large enough sample sizes for each area to compare them. This exercise shows that the geographical effects are real, persisting after the inclusion of key demographic factors and party support.

In this analysis, I focus on one particular dependent variable, relating to people’s sense of influence over decision-making in the country as a whole. There are also geographical effects for many of the other key variables, such as interest in and knowledge of politics, and people’s sense of political efficacy. However, perceptions of influence speak directly to the wider debate on parts of the country that feel ‘left behind’ and discontented with politics – and as such, geographical effects here are of real interest.

Three key themes emerge from the analysis:

  1. Londoners are uniquely likely to feel influential: there are statistically significant differences between residents of London and those of every other area in Britain.

  2. Residents of Wales and Scotland are particularly unlikely to feel influential.

  3. Rather than a North-South divide per se, it is the North East of England in particular where there is a notably lower perception of influence than in the rest of England.

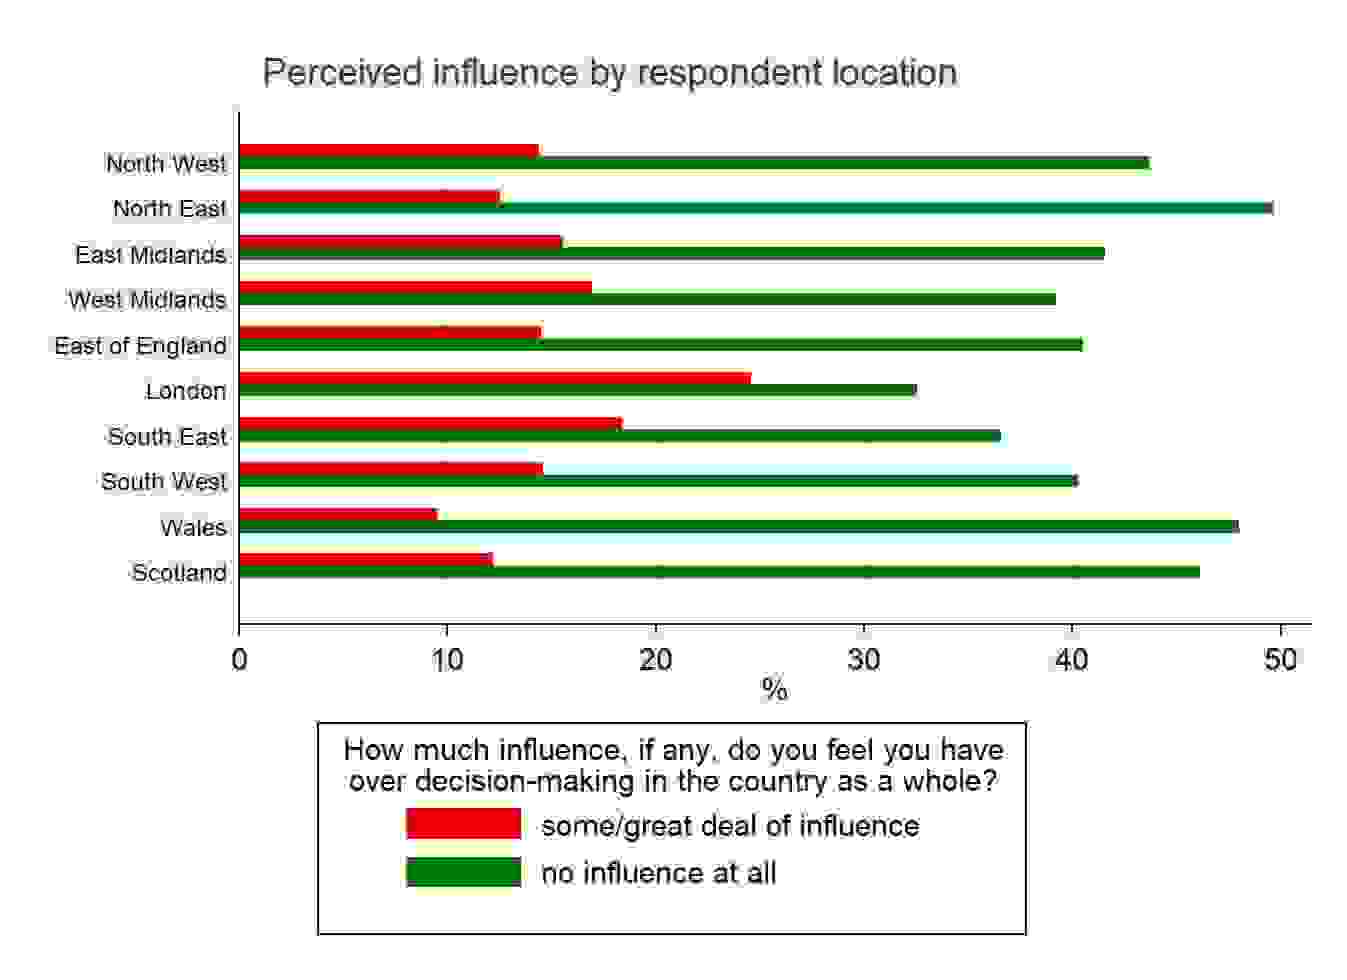
The chart below shows the geographical differences in their raw form – plotting the positive responses (those who thought they had at least a reasonable degree of influence on decision-making nationally) and the most negative responses (those who thought they had no influence at all) and excluding the group who feel they have ‘not very much’ influence.

Immediately, we can observe a substantial degree of variation. While even in London more people give negative than positive responses, the gap is much smaller than in the rest of the country. We can also see that Wales and Scotland stand out compared to most regions of England. In these areas, nearly half of the population believe that they have no influence at all on national decision-making. Finally, compared to not only London but also the South and Midlands, people living in northern England are especially likely to feel they have no influence on national decision-making, particularly if they live in the North East.

While it gives a useful indication, the chart above may exaggerate the ‘true’ geographic effect, since parts of Britain differ on the basis of demographics and party choice.

To address this, I modelled the effect of geographic area, controlling for several factors. I selected five which might a) affect perceptions of influence; and b) vary by geography. The five were, firstly, a measure of social class based on occupation (the common NRS social grade); secondly, a three-category measure of level of education, from no qualifications to degree level; thirdly, a two-category measure of home ownership (whether the respondent owns or rents their home); fourthly, whether the respondent was white, or belonged to an ethnic minority; and finally, the party the respondent told us they intended to vote for (including a category for non-voters).

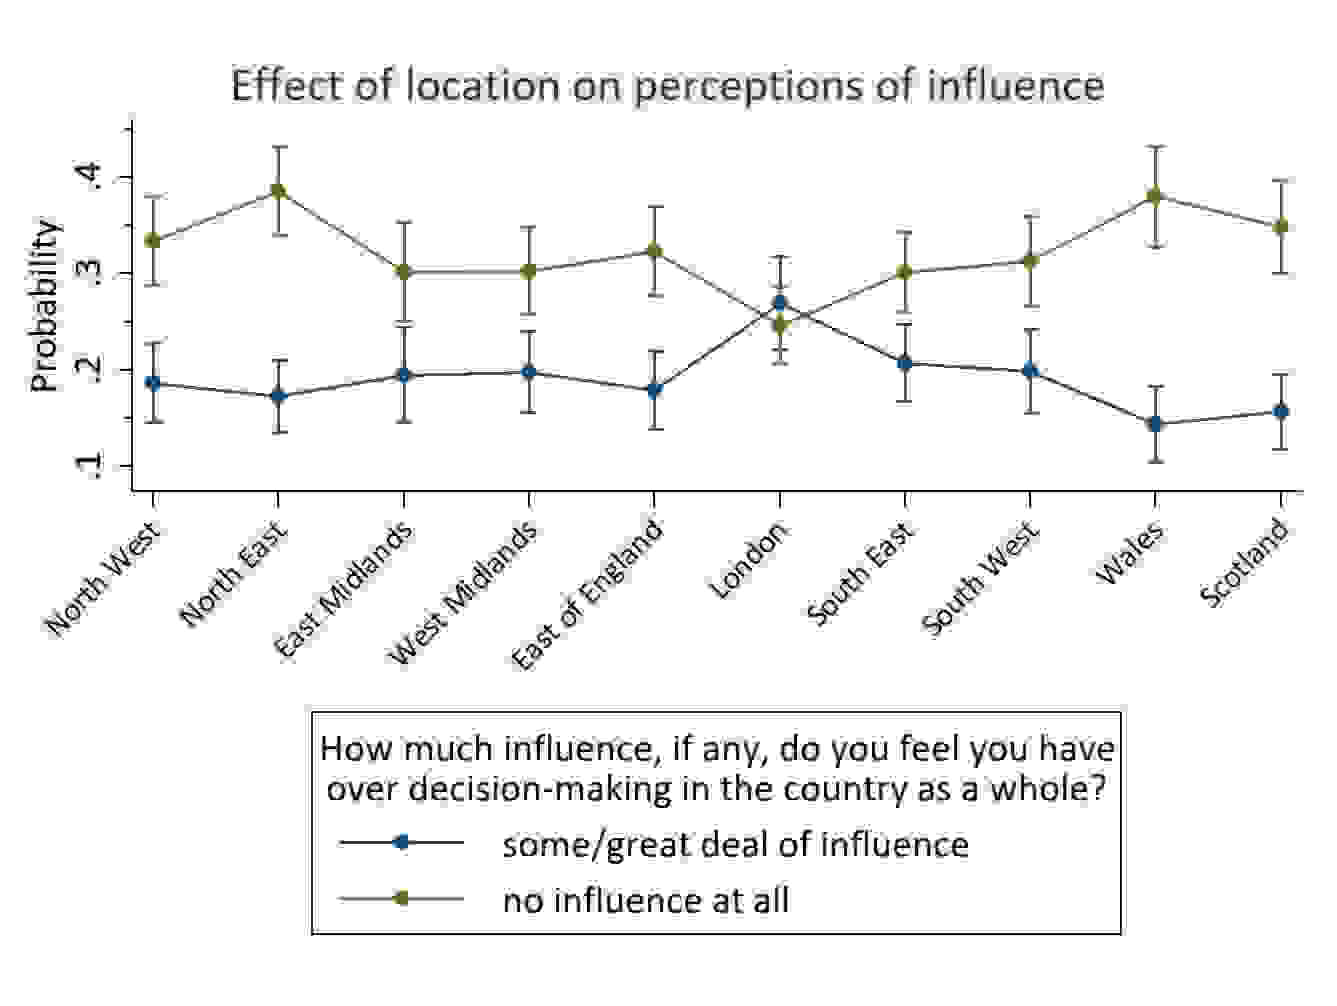
The following graph shows the predicted probabilities of selecting the ‘some/great deal of influence’ or ‘no influence’ response for a white, lower middle class, home-owning Conservative in the different parts of Britain, where the dots represent predicted probabilities. The bars represent 95% confidence intervals for these predictions: that is, there is a 95% certainty that the true probability of selecting the response is within the range indicated by the bars. There is no real importance to the choice of demographics or party used in any example (i.e. in this case white, lower middle class, home-owning Conservatives). The respondent characteristics simply have to be specified to output the predictions, but they do not change the effect of geography.

Compared to the first chart, the differences by area do not look quite so extreme: accounting for differences in demographics and party support has somewhat reduced the effects of geography. However, relatively substantial geographical differences persist, reflecting the three themes that we observed earlier. Londoners are indeed substantially more likely to perceive that they have influence on decision-making nationally, and less inclined to believe that they lack any influence at all. Residents of Wales and Scotland – especially compared to London – are markedly more likely to believe they have no influence at all. Finally, as before, residents of the North East are particularly likely to believe that they have no influence on decision-making at the national level.

Clearly, geography appears to be of some significance to people’s attitudes. However, we can go further: it seems that where you live may, in some cases, be more important than who you are (in terms of demographic characteristics). The increase in perceived influence from living in London, as compared to living in the North East, is more than twice as strong as the effect of having a degree compared to having no qualifications, and of being in the highest social classes (AB) compared to the lowest (DE).

It is not clear what exactly might drive geographic divides. One possibility is that places that are more physically distant from the seat of power in Westminster feel left out of what happens there. A second possibility is that people in certain areas feel they lack influence because they don’t see those areas as being well represented within the political class. The backgrounds of our representatives in Parliament skew heavily towards London and the South. It is also possible that geographic divides are driven by real differences in outcomes - for instance, in income, wealth and economic growth - that might cause Londoners, in particular, and to some extent those living in the South more generally, to be less likely to believe the system excludes and lets them down.

This list is far from exhaustive, and the reasons are likely more complex than can be captured here. Despite this, we can say with some degree of certainty that geography really matters: to some extent, at least, how influential you feel depends on where you live.

(Note: In this analysis the data is not weighted to account for the differences in sample size between the surveys year-on-year. In theory, this means that years where more people were surveyed have a greater bearing on the results obtained. However, if the data is weighted to remove the effects of survey year there is only one significant change: an increase in the proportion of ‘no influence’ responses in the East Midlands)

News / What has Keir Starmer got in common with Robert Redford? - Parliament Matters podcast, Episode 42

The legislative process is underway following the King’s Speech, so what bills are planned? This week, Professor Philip Cowley, an expert on parliamentary rebellions, joins the podcast to discuss managing a mega-majority. Intriguingly, he reveals why Keir Starmer reminds him of Robert Redford.

19 Jul 2024
Read more

Briefings / Back to Business 2024: A guide to the start of the new Parliament

The new Parliament will assemble on Tuesday 9 July 2024, five days after the General Election. This guide explains the ceremonial, legislative, organisational and procedural processes that are engaged at the start of the Parliament.

03 Jul 2024
Read more

Guides / How does Parliament approve Government spending? A procedural guide to the Estimates process

In order to incur expenditure the Government needs to obtain approval from Parliament for its departmental spending plans. The annual Estimates cycle is the means by which the House of Commons controls the Government’s plans for the spending of money raised through taxation.

16 Jan 2023
Read more

Blog / Mock Elections 2024: The results are in!

Results are in for the Hansard Society's nationwide Mock Elections. Thousands of pupils have cast their ballots and the results show that Labour has won the election among pupils across the country, with 27.3% of the vote.

04 Jul 2024
Read more

News / Who will be the stars of the new Parliament? - Parliament Matters podcast, Episode 40

With a 50% new intake and 40% female representation, the latest parliamentary group promises exciting new talent. Renowned journalist and 'Tomorrow’s MPs' watcher Michael Crick shares his insights on the standout figures to watch in the coming years.

07 Jul 2024
Read more